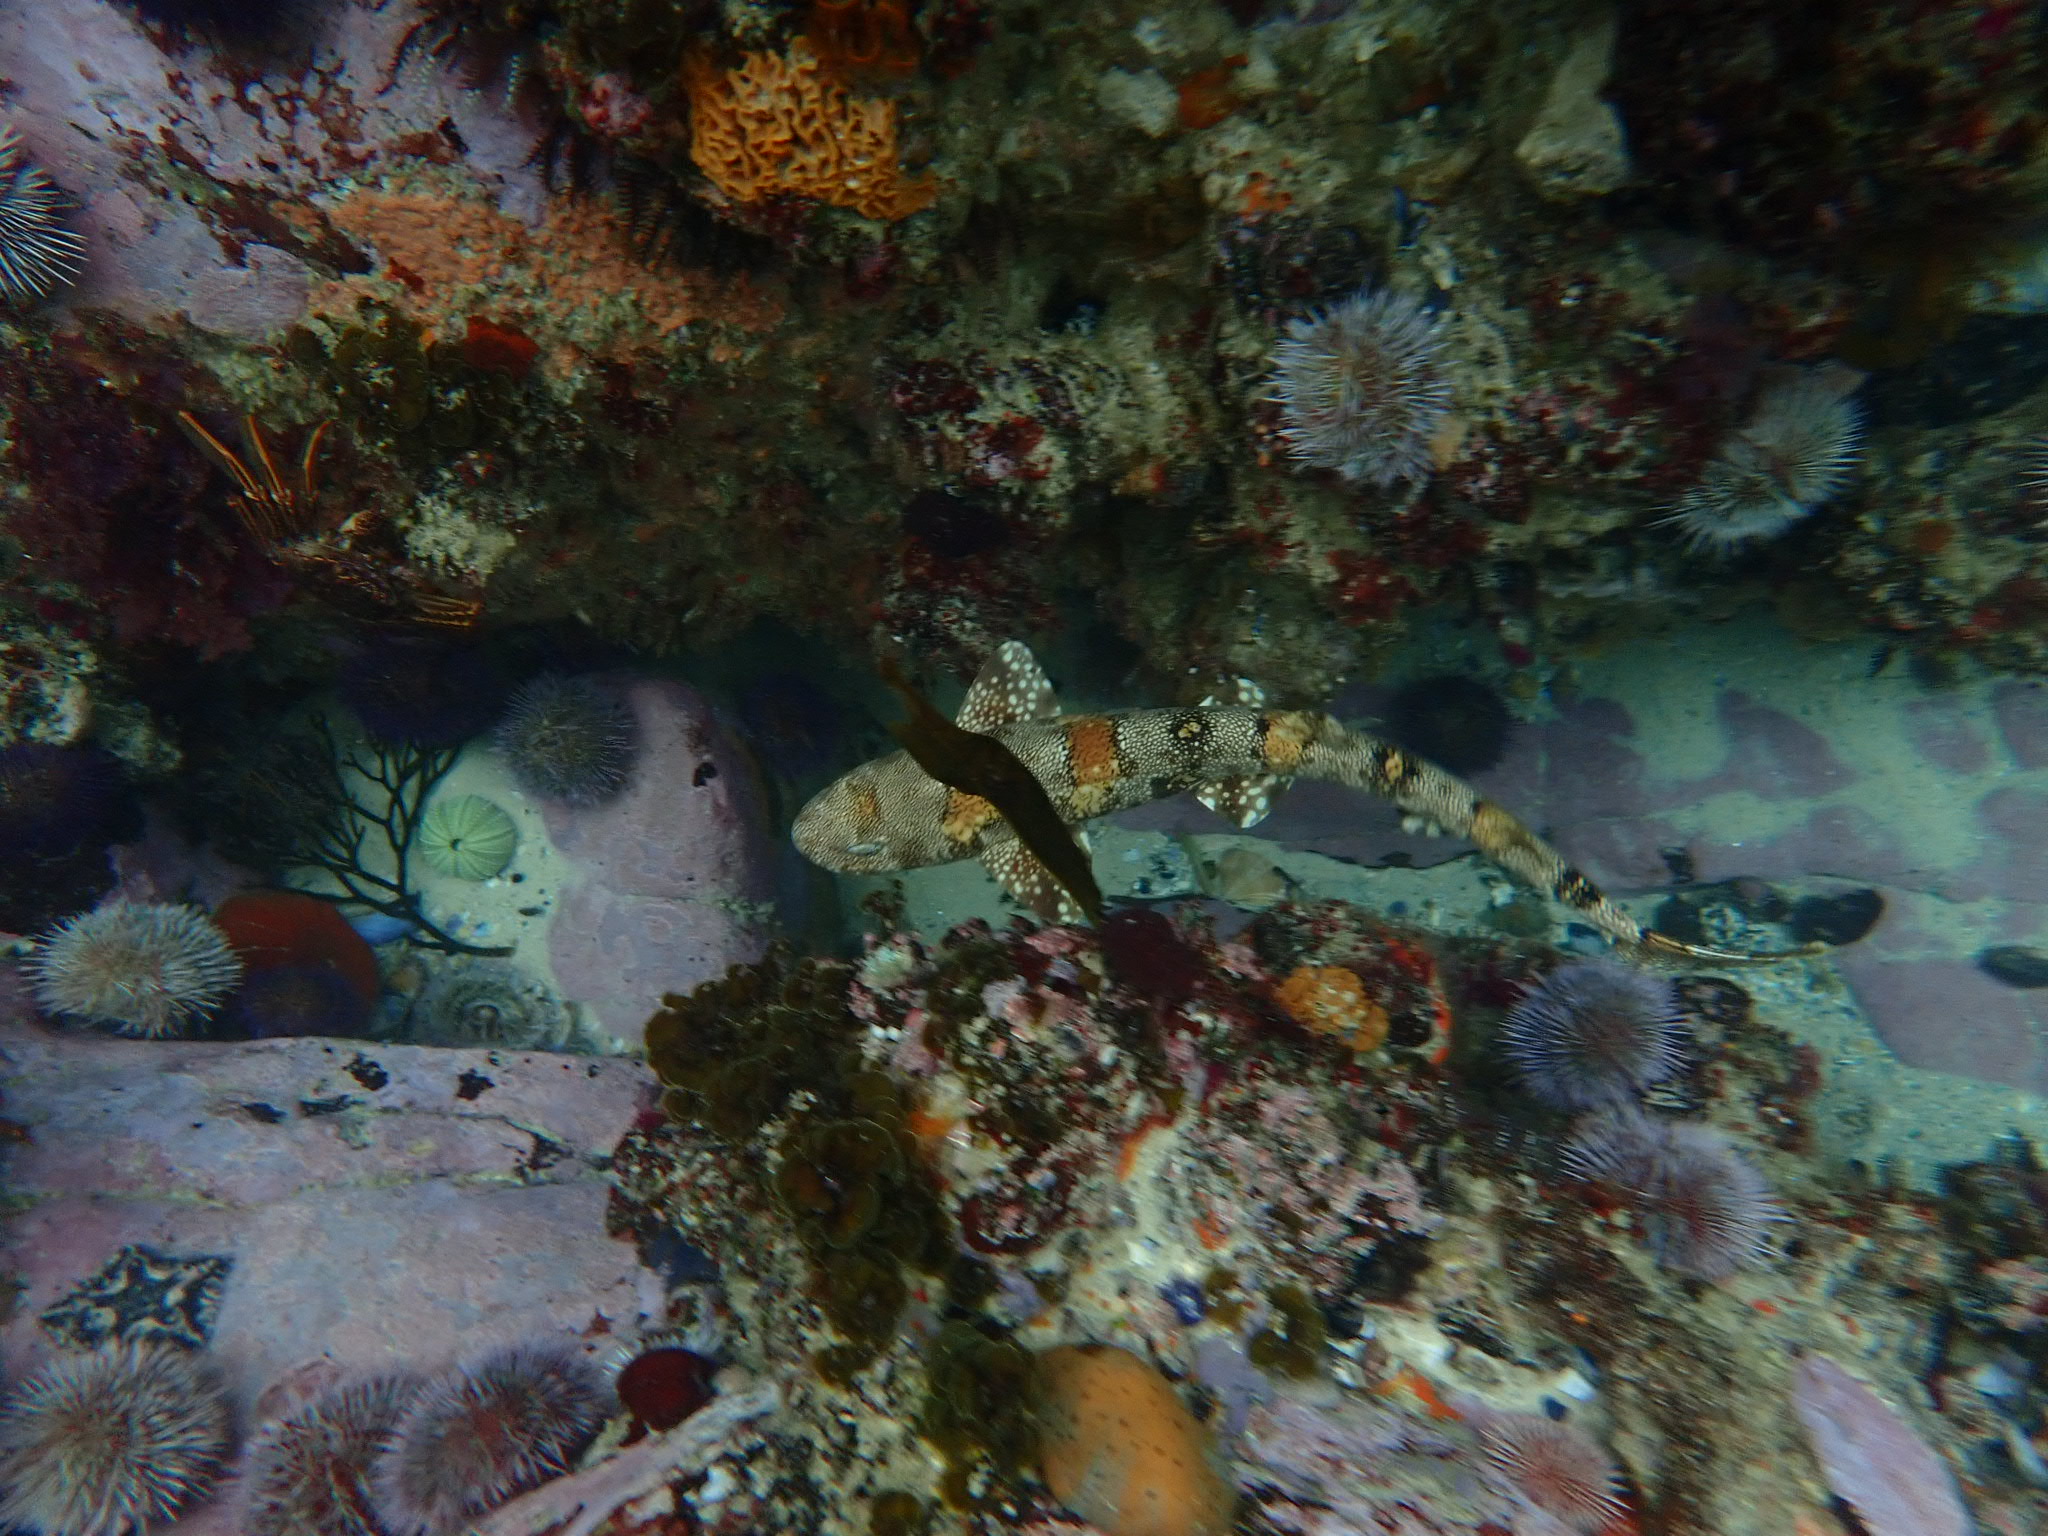
What a boring header image!
A shallow dive into some of the data
We launched Fin Spotter last year as the next generation of our popular Citizen Science study into the fish biodiversity of False Bay. Being shark lovers, it was a natural progression, and dare I say that it’s become our flagship project here at Cape RADD. What can I say, we love it! (Here’s how you can get involved.)
In celebration of being allowed back on the beaches (to collect MORE data), let’s step back and take a look at some of the data that we have collected so far!
What is Fin Spotter again?
For the uninitiated, Fin Spotter is our database of benthic shark encounters. We use machine learning and computer vision to identify individual shysharks and catsharks based on their unique patterns of spots and stripes. Records of their encounters can then be used to estimate demographic parameters like probability of survival and abundance (how many there are). And that’s just what we’ll do today!
For today we’ll focus on Long Beach, our most frequently sampled site.
Some Numbers…
Number of uniquely identified individuals per species
42
Puffadder shyshark
Haploblepharus edwardsii
33
Dark shyshark
Haploblepharus pictus
19
Pyjama shark
Poroderma africanum
8
Leopard shark
Poroderma pantherinum
We’ve identified over 100 individual sharks at Long Beach alone!
Next we’ll look at the most resident individuals, that is, those that have stuck around the longest. As of the time of writing:
These kinds of numbers always fascinate me. The bigger they are, the better indication that our sharks are surviving!
The longest period of absence numbers follows a similar trend.
I find this statistic equally fascinating. HE_062 is a particularly interesting case, as it was first sighted in November 2020, and then only seen again 3 weeks later, but in the exact same spot. And we most certainly checked in between that time. Where are they going? How do they know to come back?
It is still very early days however, so take these numbers with a grain of salt. They don’t necessarily mean a shark was gone for 4 days, but more likely, we didn’t do any diving for 4 days (especially over the December holiday!). To get a clearer picture, we need more data!
We can visualise this with a common plot for assessing effort in population studies, the discovery curve.
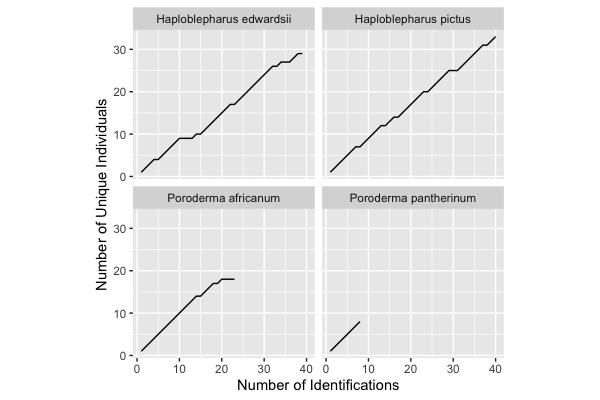
A discovery curve is a good tool for visualising effort in a study; it shows the cumulative number of unique individuals as a function of the cumulative number of encounters. So as we encounter sharks, how many are sharks that we’ve seen before? When our sampling effort has become saturated, that is, we are starting to see the same sharks over and over again, this curve will flatten out, or asymptote. For the most part, we’re still seeing a 1:1 relationship. So…more sampling!
A model
What I’m going to do next goes against my better judgement as a scientist. There simply isn’t enough data here to pretend that any kind of population model would be meaningful, but desktop studies are a nice way to explore the data, assess the study design and to plan the next steps. And Mike has a gun to my head. (Seriously, he told me to ‘get back behind the computer where I belong’ yesterday!)
The POPAN parameterisation of the Jolly Seber model is a conceptually simple model for open populations that estimates parameters for the probability of detection (p), the probability of survival (ϕ), the probability a new individual enters the population (b) and abundance (N). It might not be the most appropriate model here, but it is easy to implement and a good place to start.
To begin, we need encounter histories for each individual. An important piece of information that we are missing though are the number of occasions where no sharks were encountered. I built encounter histories for each of the positively identified puffadder sharks at Long Beach, under the assumption that on no day did we see zero sharks, and that we photographed all the sharks we encountered. This resulted in encounter histories for 37 sharks across 14 sampling occasions.
Then I fit a model with a constant probability of survival, a constant probability of detection, a time varying probability of entering the population and a constant abundance.
The results? Drumroll please…
Estimated number of puffadder shysharks at Long Beach
4025
That can’t be right!?
No, it probably isn’t. Like I said, I don’t think we’ve sampled nearly enough for any reliable estimates, and I didn’t give the suitability of the model any more than 5 minutes of thought, but it would be interesting to see how this number holds up as we go on.
Some points to note
The confidence interval on this estimate is massive (958 – 16906 sharks).
I also recall that one of the encounters I used is actually a dead shark! The probability of survival estimated from this model is quite high (0.91), but one of the sharks was dead – an important piece of information as it allows us to estimate true survival, but I haven’t done that here.
I’ve also not allowed for any cohort differences, nor have I included covariates at all for that matter. There’s a possibility for seasonal, or cohort (male/female) differences in some of these parameters. It would be interesting to test some of these as the project grows, specifically whether there are any differences in survival between no-take vs. unrestricted areas of the Table Mountain MPA.
A study of Pyjama sharks from Mossel Bay found annual probabilities of survival of 0.716, and seasonal probabilities of capture ranging between 0.13 to 0.84 with much lower probabilities of recapture, resulting in abundance estimates ranging from 11 to 53 sharks. Despite using a different model, our notably lower daily probability of detection (0.007) might be what is driving our abundance estimate so high.
That’s it for now, if you’ve made it this far and are keen to support the project, consider adopting a shark and we’ll let you give it a more exciting name than HE_001, and we’ll let you know each time we see it!
0 Comments